I Doubled my Investment
While catching up with an ex-colleague from the stock market over coffee, an important concept was triggered when he claimed:
“I doubled my money in the stock market”
WOW! My mind immediately started wondering which hidden gem he had discovered to double his money so quickly. NVIDIA? Tesla? Some tiny company I’d never even heard of?
Before asking him which stock it was, I asked something much more important.
“How long did it take?”
“About 15 years”
The look on my face right after:

Suddenly, the conversation changed..
At that moment, I realised we weren’t really talking about investment returns anymore.
We were talking about CAGR.
Doubling your investment sounds impressive, but without knowing how long it took, the achievement tells us very little.
An investment that doubles in three years tells a very different story from one that takes fifteen.
Yet, this is one of the biggest mistakes investors make. We love talking about total returns, but we rarely talk about the time it took to achieve them.
That’s exactly why CAGR exists.
Rather than asking how much an investment grew, CAGR asks a far more useful question:
“How fast did it grow each year?”
Once you understand this simple concept, comparing investments becomes significantly easier.
So, what is CAGR, and why do experienced investors rely on it when comparing investment performance?
What is CAGR?
Before we go any further, let’s quickly understand what CAGR actually means.
CAGR stands for Compound Annual Growth Rate.
It measures the average annual rate at which an investment has grown over a specific period, assuming that any gains were reinvested and growth compounded each year.
Think of it as the “speed” at which your money grew.
Instead of simply saying: “My investment returned 150%”
CAGR allows you to say: “My investment grew at an average annual rate of 9.6% over ten years.”
Now that paints a much clearer picture.
Why Total Return Can Be Misleading
Let’s imagine 2 investors:
Investor A:
- Invested $100,000
- Finished with $200,000
Investor B:
- Invested $100,000
- Finished with $200,000
At first glance, both investments look identical. Both doubled. But here’s the detail that changes everything.
Investor A achieved this result in 5 years. Investor B took 15 years.
Would you really consider these investments equally successful?
Probably not.
Here’s why:
Investor A
CAGR: 14.87%
Investor B
CAGR: 4.73%
Suddenly those two identical investments don’t look so identical anymore.
That’s precisely why experienced investors rely on CAGR rather than total return alone.
It allows investments held over different periods to be compared on equal footing.
How Is CAGR Calculated?
The formula for CAGR is:
CAGR = (Ending Value ÷ Beginning Value)^(1 ÷ Number of Years) − 1
At first glance, the formula looks like something from a high school maths exam. Fortunately, you don’t need to remember it.
That’s exactly why I built this CAGR Calculator, which calculates your annualized return in seconds without requiring you to remember the formula.
Simply enter:
- Starting Value
- Ending Value
- Investment Period
The calculator instantly determines your annualized return.
Once you’ve calculated your historical CAGR, you can use my Investment Growth Calculator to estimate how your portfolio could grow if those returns continued into the future.
You can also explore my complete collection of Finance Tools, including calculators for compound interest, investment growth and more.
Why Investors Use CAGR?
CAGR has become one of the most widely used performance metrics because it removes much of the noise from investment comparisons.
It helps investors:
- Compare investments over different time periods
- Measure portfolio performance
- Evaluate mutual funds and ETFs
- Compare stocks against market indices
- Assess long-term business growth
- Measure revenue or profit growth over time
It’s equally useful whether you’re investing $50,000 or managing a multi-million-dollar portfolio.
Imagine you’re choosing between two funds.
One returned 180% over 20 years.
Another returned 95% over 7 years.
Which performed better?
Without CAGR, it’s surprisingly difficult to answer.
What Is Considered a Good CAGR?
This is probably one of the most common investing questions I come across.
And honestly? My answer is almost always the same:
“It depends”
A “good” CAGR depends on:
- Your investment objective
- The amount of risk you’re willing to take
- Market conditions
- The time period being measured
That being said, many long-term investors would generally view:
- 5-7% as respectable
- 8-12% as strong
- 15%+ as exceptional if sustained over many years
The important thing here isn’t chasing the highest CAGR. It’s earning returns that consistently outperform inflation while staying aligned with your risk tolerance.
Curious how long it would take for your money to double at those returns? My guide on the Rule of 72 explains a simple mental shortcut every investor should know.
CAGR vs Average Return
This concept usually confuses many investors.
Suppose an investment gains +40%.. -20% .. +15%
The average return appears attractive, but that’s not how your portfolio actually grows.
Investment returns compound, gains and losses build upon one another.
CAGR accounts for this compounding effect, making it a much more accurate representation of long-term investment performance than a simple arithmetic average.
If you’d like to understand why compounding is often called the eighth wonder of the world, I recently wrote a detailed guide on How Compounding Actually Works.
Limitations of CAGR
Like any financial metric, CAGR has its limitations.
It assumes growth occurred smoothly over time.
In reality, markets rarely move in straight lines.
A portfolio may experience significant volatility before arriving at its final value.
CAGR also doesn’t account for:
- Additional deposits
- Withdrawals
- Dividends taken as cash
- Investment timing
If you’re regularly adding or withdrawing money, metrics such as XIRR (Extended Internal Rate of Return) may provide a more accurate picture.
Unlike CAGR, which assumes a single investment made at the beginning and sold at the end, XIRR accounts for multiple cash flows made on different dates, making it particularly useful for investors who contribute monthly through SIPs or make occasional deposits throughout the year. I’ll be writing a dedicated guide on XIRR soon, including when to use it instead of CAGR.
CAGR should therefore be viewed as one useful tool, NOT the only metric that matters.
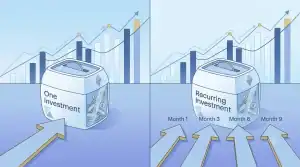
If you’re investing regularly rather than making a single investment, you may also find my comparison of SIP vs Lump Sum Investing useful.
Final Thoughts
My friend wasn’t wrong. He had doubled his money.
He had simply left out the most important part of the story.
Time.
Investing isn’t just about how much your money grows.
It’s about how efficiently it grows.
That’s exactly why CAGR has become one of the most important metrics in investing.
The next time someone tells you they’ve doubled their money…
Don’t ask which stock.
Ask:
“How long did it take?”
That’s the question every great investor eventually learns to ask.